Ah, pwn: one of the more addictive categories of CTF once you get the hang of it. The moment when your payload actually works reminds me of a quote I’ve heard about math: “the joy of mathematics is largely the receding of pain.”
But because pwn relies on so many other topic areas–software reverse engineering, understanding computer memory, some programming and scripting knowledge, data types, and so on–the learning curve can be intimidating.
The “hello world” of pwn is a buffer overflow.
“Hello world” in programming is, at least in theory, an example that gets you started in a new language without a ton of extra setup or understanding.
As I’ve alluded to, it’s a bit more complicated in the world of pwn. Hence, this guide on buffer overflows.
I’m far from the first person to write about buffer overflows. Heck, it was in Phrack in the 90s, and even that was described by Aleph One as being a written record of things understood elsewhere, if memory serves correctly.
So why am I duplicating efforts?
Because a lot of people (including myself) are visual learners, and I’ve written some software to help others visualize how I see buffer overflows in my head. And I hope it helps you too.
This post is about learning buffer overflows in a visual way, featuring:
- Several helpful animations I made, plus one gif I stole
- A way of approaching pwn skills so that you don’t go (as) insane
- Why reverse engineering is like a jigsaw puzzle on hard mode
- Why stack overflows are like dealing with toddlers
- And what to do when yelling at your computer doesn’t actually solve the pwn challenge you’re working on.
Plus, of course, how buffer overflows work (which means looking at endianness, ASCII, hex, the stack and stack frames, instruction pointers, and more). And if you’re new-new, don’t worry, we’ll talk about CTFs, pwn, and software reverse engineering tools as well.
Pwn and Binary Exploitation
Note: I’ll use pwn and binary exploitation interchangeably in this post.
This guide is based on a talk that I did, pre-COVID, about how to get started in exploit development. As a CTF addict, my mental framework (and how I presented the talk) is largely around CTF challenges.
But pwn isn’t just for CTFs.
Why are we learning this?
Yes, getting good at pwn will earn you a lot of cool internet points (aka CTF flags), but what else is it good for?
Learning pwn skills can also help you do security assessments as a pentester, earn your OSCP, or do security research, specifically exploit development. It stands to reason that anything with reverse engineering has a bit of “forward” engineering understanding in it as well, so time spent picking apart computer programs can make you a better engineer or developer, too.
A few more words on exploit development:

These headlines are all real world outcomes from pwn (aka exploit development) skills. Exploits, as discussed here, are software tools written to exploit some kind of flaw in a particular program. They can range anywhere from a proof of concept that shows the issue exists but is otherwise benign. It could be something presented at an event like Pwn2Own, where researchers demonstrate ways of hacking new products via exploits that they’ve written. Or we could be talking about exploits that are fully developed, whether by governments (kept secret) or by hackers who share them with the world on a site like ExploitDB.
Exploit development is built on a lot of other fields and skills. A non-exhaustive list:
- There’s reverse engineering, which in this case refers to taking a binary file, which is the output of compiled source code, and mentally reconstructing its functionality to understand how it functions and how it might be vulnerable.
- Related to that, there’s binary analysis, which is methods of instrumentation around reverse engineering.
- There’s vulnerability discovery or analysis, which refers to ways of finding issues that could potentially be used to develop an exploit. This could be source review. This could be fuzzing, which is throwing a bunch of crazy inputs at something to find unexpected behavior or code paths.
- There’s shellcoding, which refers to writing tiny, self-contained programs to do something like provide access, connect back to something, etc. We won’t get to that in this guide but might in a future guide.
- There are also foundational skills like programming in C, assembly, scripting, etc.
That’s a pretty daunting set of skills, even once you’ve made it past the foundational skills, which is nothing to sneeze at.
How should we learn pwn skills?
This was originally titled “what’s the best way to learn pwn?” but I can’t answer that for you, I can only share what’s worked for me.
They say that to a hammer, every problem looks like a nail, and as a CTF addict, I think CTF challenges are a great way to tackle this big skillset.
A CTF (capture the flag) is a hacking competition where you’re given a bunch of challenges made especially for that competition (you’re not just hacking random things), and if you solve a challenge, you get points. The person or team with the most points wins.
CTFs have several different categories to reflect different aspects of infosec. Two of them are reverse engineering, which we already know about, and “pwn”, which is kind of like applied reverse engineering + shellcode. The goal is to use a vulnerability in a program (usually found through reverse engineering or source review) to get a program to do unintended things, like read a flag file from the computer.
The pwn category, also called binary exploitation, lets us practice reverse engineering, exploit discovery, exploit development, shell coding, everything all in one.
CTFs are great because they can trick you into spending a lot of time learning a new concept in a way that feels more fun than maybe traditional book learning, because you get points at the end.
And, if you arrange things right, you can “stair step” your way from very basic binary exploitation to more complex challenges.
Here’s an idea of where you can go:

This graphic isn’t exhaustive either, but hopefully it gives you an idea. It also roughly follows the historical path that exploit development took: hackers discovered one vulnerability, and it was patched or mitigated. So they had to discover another, and another, in an unending game of cat and mouse.
Software Reverse Engineering Tools
When I try to explain software reverse engineering (RE) to someone outside of the field, I explain it like this:
Imagine you were given a box of puzzle pieces without a photo on the box to help you put it back together. Can you figure out what the image is supposed to be?
In our analogy, what might you do to start? One classic piece of puzzle strategy is to find all the edge pieces, and put those together. This gives you a framework of sorts, a sense of orientation, a starting point.
Not unlike our jigsaw puzzle, software reverse engineering also benefits from getting one’s bearings. What architecture is it? Where is the starting point of the program? Are there any patterns or paths we see once we’ve arrived at that point?
Software RE tools can help us do this, whether that’s command line tools, binary analysis scripts, or common RE tools like Ghidra, Binary Ninja, and IDA Pro. These tools allow us to determine things about the program we’re analyzing, whether that’s what the architecture is, where the program starts, and what paths it can follow from there.
Back to our analogy: once you’ve got the border sorted out, you might start picking out puzzle pieces based on colors or patterns that seem to go together. Then you piece together small fragments of the puzzle that give you clues about how the bigger picture might look.
This is not unlike how SW RE tools let you view related groups of machine code that (likely) correspond to functions or sub-functions within the program. I say “likely” because in both cases–using RE tools and putting a puzzle back together–you are working backwards to approximate the real thing, but it’s not a guarantee that you or your tools will interpret things correctly.
How this actually works is a whole ‘nother topic, but for now, the important bits are:
- Disassembler: takes a binary file and displays it as assembly for a given architecture.
- Decompiler: takes a binary file and approximates the original source code.
- Debugger: view and change running state of program.
We’ve mentioned reverse engineering quite a bit but haven’t really defined it, so let’s do that now. If “forward” engineering looks like this, in terms of a computer program:
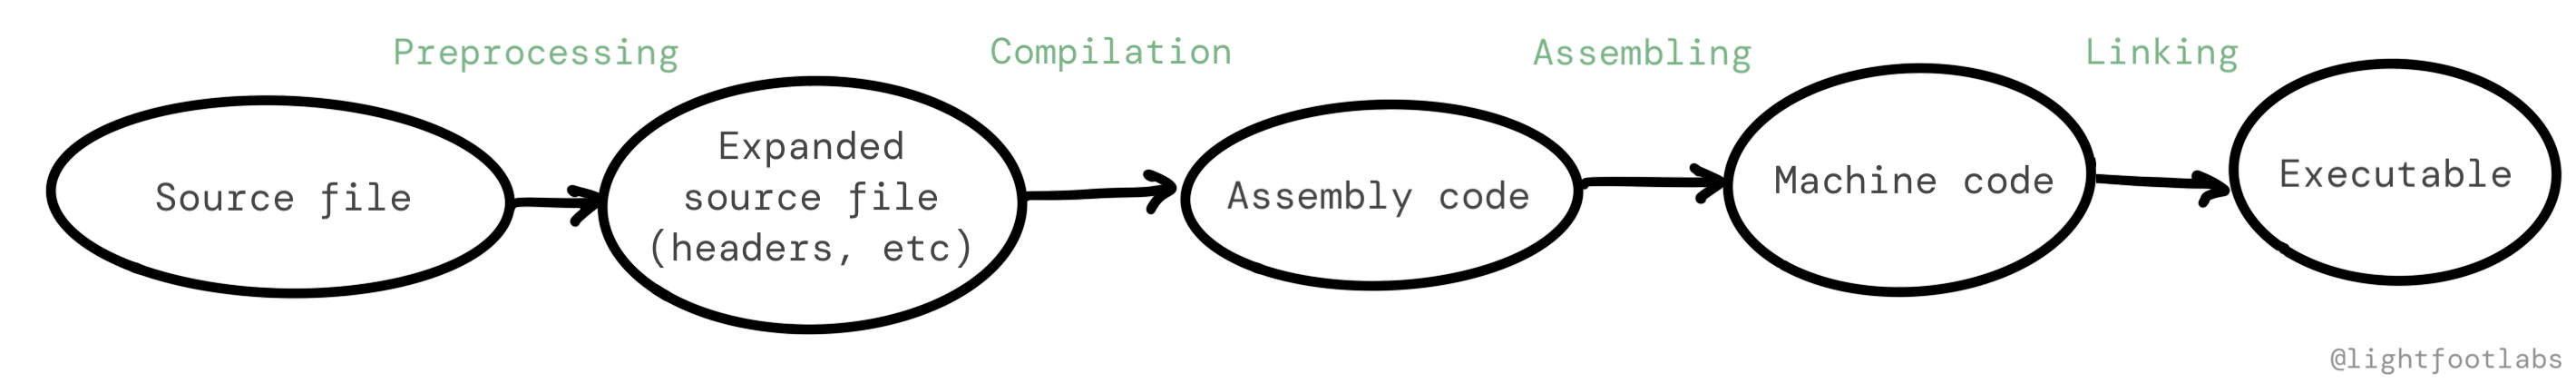
Then reverse engineering looks like this:

In other words, reverse engineering takes the output of the normal (“forward”) process, and uses a combination of software tools and human understanding to understand the original functionality and intentions.
I’ve grouped both disassembly and decompilation together in this diagram. If you use a disassembler such as gdb, you are able to view assembly instructions, and then it’s up to your understanding to build a mental model from there.
If you use a decompiler, that’s one more step in the diagram, but the output still requires effort on your part. The reconstructed high-level language is an approximation, and might appear obfuscated because things like variable names and comments aren’t there.
Disassemblers, decompilers, and debuggers are the tools that we’ll use to piece the puzzle back together. Luckily for us, the following examples will contain the original puzzle picture, so to speak.
A Basic Buffer Overflow, AKA Yelling at the Computer
Enough chit chat, let’s get started.
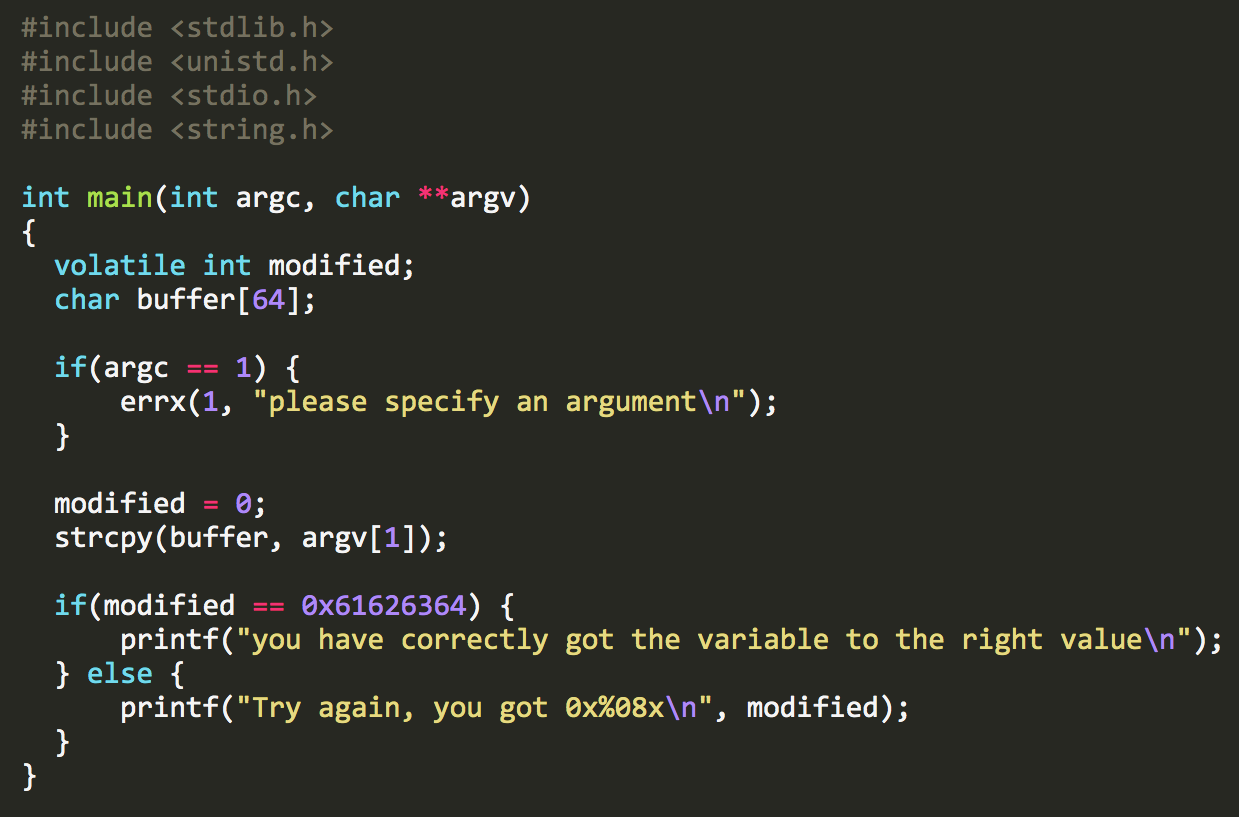
This guide will be using examples from exploit.education, which is a site with a great set of pwn practice environments. Specifically, This is level 0 from Protostar

We need to know enough C to understand what’s going on here. If the following explanation is still not enough, I recommend this online resource, and/or reading the second chapter of Hacking: The Art of Exploitation.
Here’s a marked up copy that I will quickly explain. Feel free to skip ahead if you’re familiar with C.

- We first
includesome standard libraries that define variable types and the I/O functions we want to use, likegets()andprintf(). - We define our
mainfunction with theint main(...)line. Theargcandargvparts mean that the function can accept command line arguments (but our program doesn’t use them, in this case). - We define a variable called
modified. It is of typeinteger(orintfor short), which defines its size and what values we expect to store in the variable. It’s markedvolatile, meaning we want the compiler to know its value can change unexpectedly. In other words, we’re asking the compiler to please not optimize out code that appears to be a dead end. - We declare a buffer variable that is 64
char(s) long. We’ll use this to store the user input that we’ll ask for in a minute. - We set
modifiedto 0. - We call
gets()with the argumentbuffer. When this program is run from the command line, it will prompt the user for input when it gets to this step. Then, the program will store the provided input in thebuffervariable. - Then, we check to see if
modifiedstill equals 0. If so, print out some congratulations. If not, well, better luck next time.
I know what you’re thinking: this is pretty silly. What reason could there possibly be for modified not to equal 0, given what we’ve just discussed?
Unfortunately, the C programming language makes it very easy to shoot yourself in the foot. You are largely responsible for your own memory management and safety.
While looking at assembly isn’t the point of this level, here’s the assembly anyway, as viewed with gdb <stack0 program filename>.

There’s nothing here that is too surprising. As before, we load a value of 0 into a variable, call gets, and then have an if/else (which appears here as a je or jump-if-equal). Then we print out a message, using puts.
We’ll get into assembly in more detail in future levels, I just wanted to touch on it briefly here.
You don’t need to understand every single line (although that would be nice), but to understand enough to achieve our goal.
But what is our goal, anyway?
At face value, our goal is to get the sweet, sweet validation of having the program print out “You have changed the ‘modified’ variable”. Maybe in the future this will be something cooler, like code execution, but for now just accept that the program’s love language is Words of Encouragement.
But on a more general level: how can we describe what we’re trying to achieve, in a way that isn’t tied to the specifics of this one program?
Find the control point(s) that will let me change the flow of the program.
What does “control point” mean? I believe I learned this term from Hacking: The Art of Exploitation. It means finding specific parts within the program where a logical decision is made, based on state or data that we have the ability to affect. Then, subvert the intended path in favor of one that we want instead.
Here? There is one if/else block. If modified is not equal to 0, print out one message. Else, print out another message. Our control point is the if/else check, but there’s no obvious way to change it, based on the C code.
I know, I promised visuals. We’re almost there, hang tight for a couple more minutes.
If there’s nothing in the C code that logically lets us change the value of modified, and nothing obvious in the assembly either, what are our options? Maybe we’re making assumptions about how the program will act. What should we do?
Let’s try yelling at the computer
When all else fails, have you tried:

Let’s try the simplest thing we can think of: typing a whole bunch of As.

That… worked?! “You have changed the modified variable”. Cool. I guess.
Why did this work?
The only thing worse as a developer than my code doesn’t work and I don’t know why is my code works and I don’t know why. So let’s get digging.
We’ve already looked at the C code and the assembly instructions for this level. That means that whatever we might find with a disassembler (which would show us assembly) or a decompiler (which would approximate the original C code) won’t help us very much. We already have that information.
Let’s try using a debugger and see if there’s anything we can notice about the state of the program.
We know that there are two (literal) variables at play here: buffer, and modified. Buffer is what we have direct control over via our gets() input, and modified is what we want to, well, modify.
If we use gdb again, we can view the state of the program before our input, by setting a breakpoint at 0x08048405 (corresponding to line 11 in the C code), telling the program to momentarily pause and let us look around. Then during that pause, we’ll look at the memory contents and see where modified and buffer are.

Then we’ll type c to continue, type (or yell) all of our As again, and stop at another pre-set breakpoint. Once we get there, the memory looks like this:

It looks like the buffer variable filled up with our input and then overflowed into the memory that came after it, which is modified. That’s a bit confusing since we declared modified first, before buffer.
Finally: time for some stack visuals.
Visualizing the Stack
No doubt, gdb is a good tool that can be made even better with extensions like gef or pwngdb.
But in my opinion, these tools still don’t show us a great view of what’s happening (especially if you’re trying to understand for the first time), so let’s make a diagram.
First things first: this is a computer program, and so every variable, function, etc. exists somewhere in memory. Rather than teach you computer data structures from the top down, we’ll start with just what we need to understand, first.
The buffer and modified variables exist on a data structure called the stack. We’ll get into more details later, but for now, we can think of it like a scratch pad for what the program is currently doing.
Since we only have one function in this level (the main function), we’ll focus on the stack being a place to store local variables within a given function.
The stack grows downward, by which we mean it starts at a higher memory address, and with each new variable or piece of data added, the subsequent memory addresses are lower. Yeah, I know, weird.
We defined the modified variable first, which was placed at 0xbffffd1c, and takes up 4 bytes, or 32 bits.
Next, we declared the buffer variable, which takes up 64 bytes. Since the stack is growing towards lower memory addresses, this is located 64 bytes before modified, at 0xbffffcdc. Remember that each new item on the stack will have a lower address in memory. 0xbffffd1c - 64 bytes = 0xbffffcdc.
In short: buffer is placed before modified in terms of memory addresses.
We can either draw a diagram with the higher addresses at the top, meaning modified is visually above buffer. In this case, when we start adding in our data (“AAAA…”), it will fill in from the bottom upwards. This is intuitive in the sense that we are displaying variables in the order that they appear in the C code, but might be unintuitive in that the memory addresses are counting down.

Alternatively, we can draw a diagram with higher addresses at the bottom. This means that our variables are displayed in ‘reverse’ order from how we defined them in code. But when we start adding in our data (which we’ll see in a minute), it fills from the top of the diagram downward. This is more intuitive with how we write normally.

I don’t think that one view is better than the other. Each has something intuitive and unintuitive about it, so pick the one that makes the most sense for you and stick with that in the following sections.
Visualizing User Input
I’ve written a simple web program that lets you input a string, like what we’re doing with our command line program. Then, it translates the input (“A”) into its hex equivalent (41). This equivalency is based on the ASCII standard, which we’ll talk about in the next level. There’s nothing special about using the letter “A”, it’s just filler.
In my mind, it makes more sense for the memory to fill upwards and then overflow at the top, much like filling a glass of water:
If you find it more intuitive to have the data fill top to bottom, like filling up a sheet of paper, here you go:
Why does it fill in left to right? And where is this magical “stack” structure in relation to… you know, everything else? Put a pin in both of those thoughts, we’ll get there in a minute.
If we add in enough, they overflow the next thing in memory, which is the modified variable that we’re trying to modify.
You’ve probably guessed that we don’t need as many As as I used. We need 64 As to fill up the buffer, plus any (singular) non-zero value after that. 65 As will work. So will 64 As and then literally any other value, like “B” (very creative!)
To solve this level, run the program, and then input 64 filler characters (such as “A”) and then one additional character that will overflow into the modified variable.
If you’d like to do this programmatically instead of counting: $(python -c "print('A'*64 + 'B')") | ./stack0
Stack Buffer Overflow Takeaways
What did we get from this exercise?
- Variables stored in the reverse order than expected, in terms of memory addresses
- C apparently does not know or care about out-of-bounds.
- Saw some gdb usage
- We can overflow into other variables**
**if there’s no out-of-bounds checking and we use a vulnerable function like gets()
Stack Overflow 2 Stack 2 Furious
On to the next exercise in the Protostar series: stack1.
Our code has changed a bit, and with it, our control point has changed too.
Now there’s an if/else block where we are checking for modified to be equal to 0x61626364.
The two other changes in this file are:
- We’re now using command line arguments.
- We’re using
strcpy()to move them into the buffer, whereas before, we were prompting for input later usinggets().
For the sake of this exercise, the outcome is the same: unsafe functions being used to move user input into a size-limited buffer, without concern about how long the buffer actually is. I’m not sure why exploit.education decided to switch things up here.
To summarize: before we just had to change modified from 0 to… anything but 0. Here, we need to be a little bit more nuanced.
What’s this 0x61626364 business about?
ASCII Characters
Data can be represented in a lot of different ways: binary, decimal, hexadecimal, ASCII, and so on. How we represent data is typically for the benefit of humans. The computer may be storing things as 1s and 0s, but humans don’t want to read 01101000 01100101 01101100 01101100 01101111, they want to see hello displayed. Same data, different representation. You can test this out at ASCII to Hex if you’d like.
Hexadecimal is another method of displaying data. The word hello could also be displayed as 68 65 6c 6c 6f.
You might be thinking: binary to decimal to hexadecimal… okay, that’s all numbers and math. But how are we mapping values to letters and characters?
That’s where the ASCII standard came in, dating back to the 1960s with some updates since then.
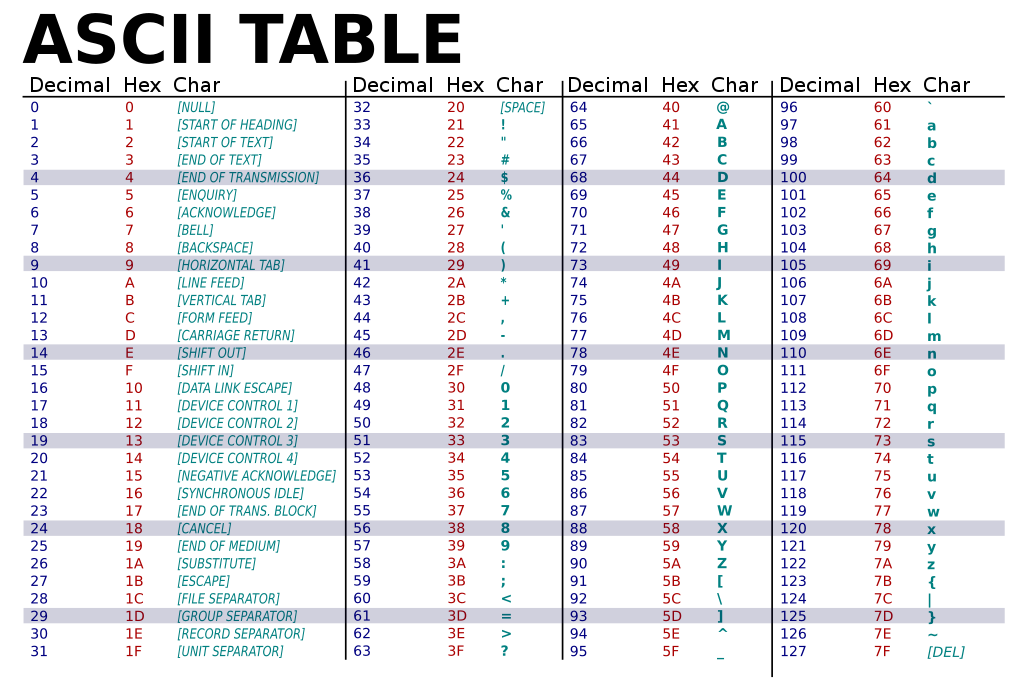
I know you didn’t come here for a history lesson, so which part should we care about here? Given the below ASCII table, you can tell that 0x61 corresponds to lowercase a, 0x62 to lowercase b, and so on.
We need to make the modified variable equal to abcd. Sounds easy enough, right? Here’s our payload: 64 “A"s to fill up the buffer, then “abcd”. But the program prints out a message that we sent 64-63-62-61, which is backwards of what we intended.

Why didn’t that work?
What is Endianness?
Well friends, it’s time to talk about endianness. This term came into use in tech in 1980 and is a reference to Jonathan Swift’s novel Gulliver’s Travels. In it, there’s a fictional community called the Lilliputians who are in bitter division over whether to crack boiled eggs from the big end or the little end.
The Lilliputian story is satire (as is the rest of the novel) and is meant to poke fun at holy wars over meaningless disputes, which never happens in tech. :)
But what does this have to do with hacking?
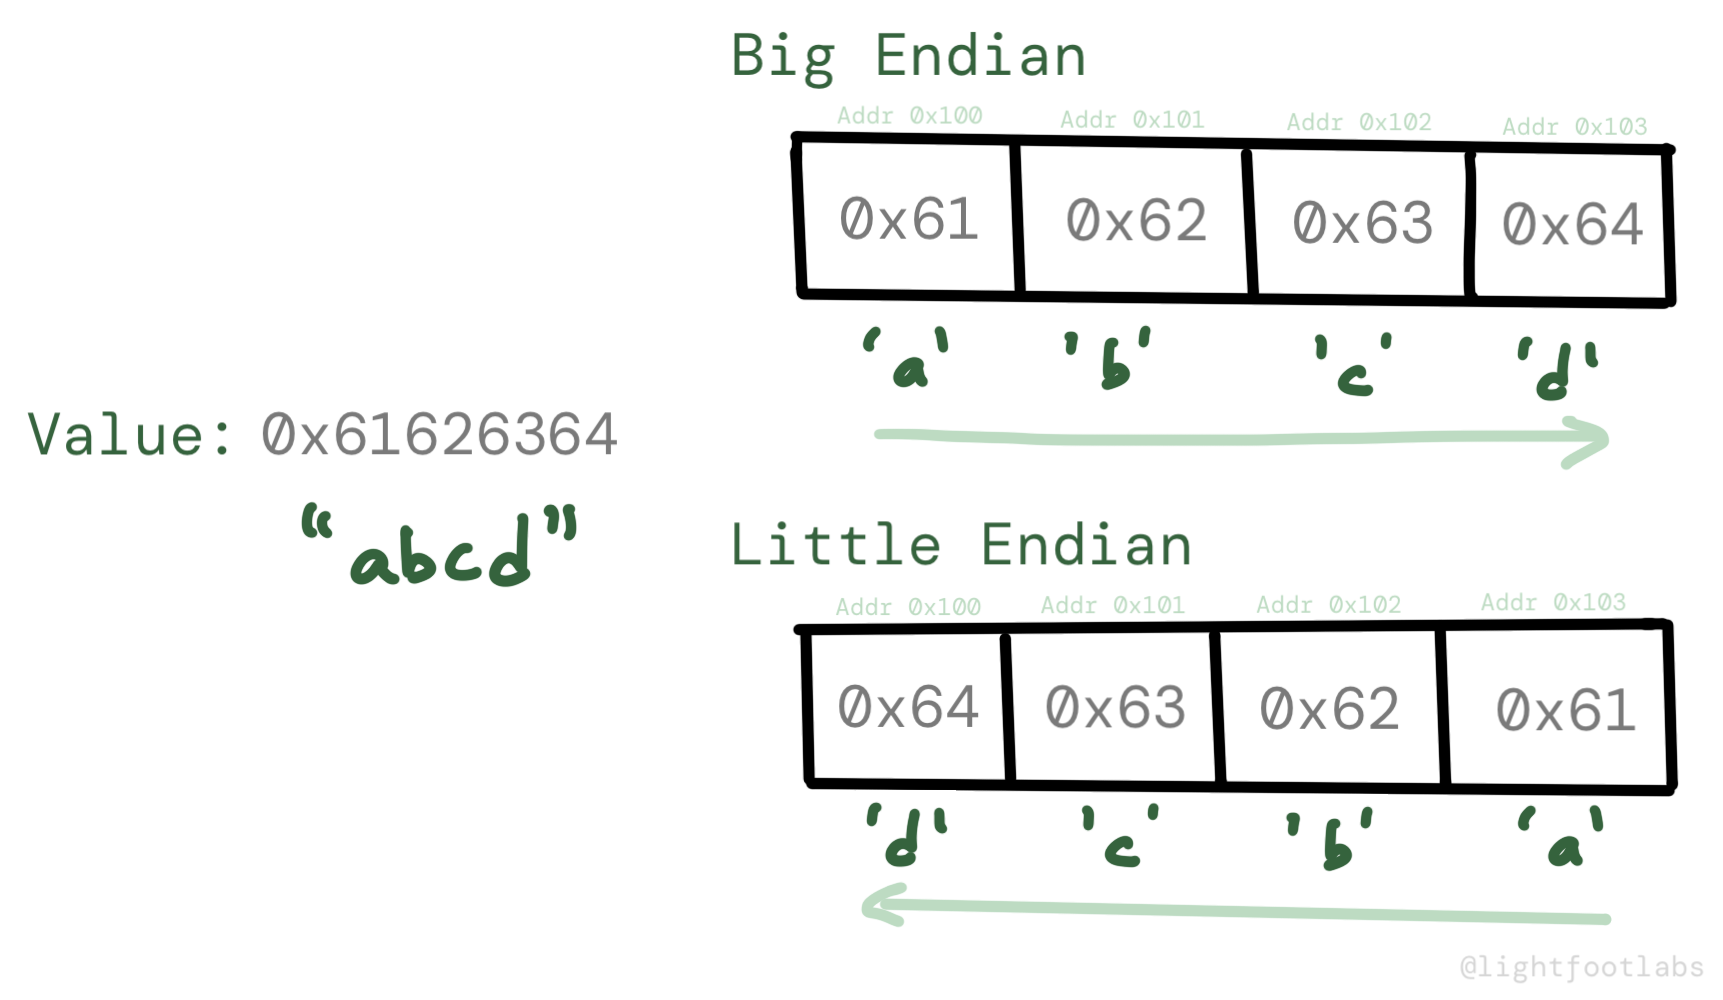
Endianness refers to the way in which a multi-byte value, like
0x61626364is stored in memory. Either ’little end’ first or ‘big end’ first.
In our case, since we have a 32-bit system, we have 4 bytes in our example, representing an 32-bit integer. In our “abcd” example, each character is equal to one byte in size.
For our 61-62-63-64 piece of data, a big endian system would store data in the same way that humans would read it: 0x61626364. The most significant byte (MSB), which is 0x61, is stored first.
But little endian means that the little end gets stored in the higher address, so we have to take the 4 bytes and swap the order. 61-62-63-64 becomes 0x64636261. The LSB, or least significant byte (0x64) is stored first.
It’s a difference from how humans represent data to how the processor stores it, and I think was originally done for performance reasons. It’s a trade-off between computer processor performance and ticking off engineers.
Accounting for Endianness
If the program said we sent “dbca” when we tried sending “abcd”, there must be a difference of endianness between what the program expects and what we’re sending.
Now that we know what the issue is, let’s try our payload again. This time, we need 64 bytes or chars of filler (“A”) and then the intended value of “abcd”, swapped for endianness: “dcba”.
Here’s what it looks like filling up the buffer:

Here’s the reverse if you prefer visualizing things the opposite way:

And here’s us getting some validation from the stack1 program:

Our payload is ./stack1 $(python -c "print 'A'*64 + 'abcd'")
What did we learn?
This level wasn’t too different from the previous one, but we picked up a few more ideas:
- Our input needs to account for endianness.
- The ASCII standard maps letters, numbers, and other symbols to numerical values. Which means ASCII characters can be represented in hexadecimal, as we saw in this level.
- Computer scientists have been discussing technical holy wars since the 1980s, at least.
Let’s keep building on this knowledge and increase our “bof” (buffer overflow) capabilities.
Buffer Overflow (“bof”) with Return Address Overwrite
This is level 4 of Protostar (yes, we skipped two levels).
Learning about endianness was cool and all, but who wants to stay in the same function all the time?
This next level has some code changes: first of all, no more modified variable to overwrite. Secondly, there’s a win() function.

We’ve got a new control flow goal. We need to get to that win function… but how?
Let’s try yelling again
Let’s try the easiest thing again, which is to yell at the computer with a bunch of As. When we try this, we get a segmentation fault and a kinda weird message.

Let’s use gdb again. If we type info registers to show the state of the registers at the time of the crash, there’s some 41s in there. We know that 0x41 maps to the letter “A”, which was our doing.
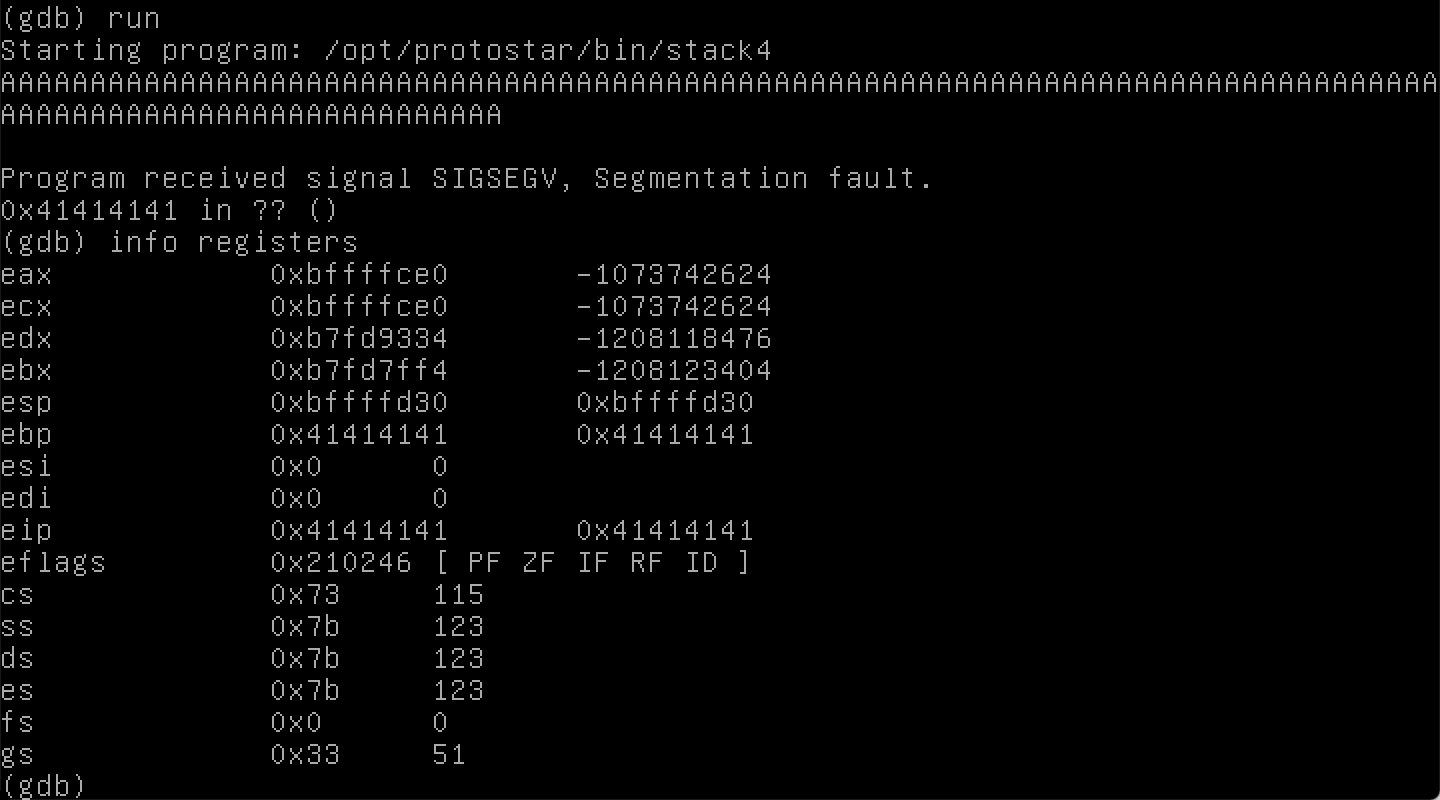
Registers are ways of storing information, current context for the program state, and evaluating different operations. It’s more than I want to get into for this already-very-long post but the book Hacking: The Art of Exploitation does a great job of introducing a bunch of concepts, including registers (even if you haven’t programmed in C before).
Back to our gdb output: We overwrote EIP, which is the instruction pointer. The instruction pointer keeps track of the location of which instruction to execute next. Do this now do this, now do this, now do this. In the first level, we saw the C code, and its assembly code equivalent. We had a mov (move), lea (load effective address), call, and so on.
If we can control EIP (and it looks like we can!), then that’s really cool. We can tell the program which instruction to execute next.
But we should figure out exactly how we were able to overwrite the instruction pointer from a seemingly unrelated variable (buffer), because that seems like something we shouldn’t be able to do.
What happens after main?
Before we got to the main function, something had to call main. Let’s not worry about what that “something” is for now. But once we’re done with main, presumably we need to go back there, right?
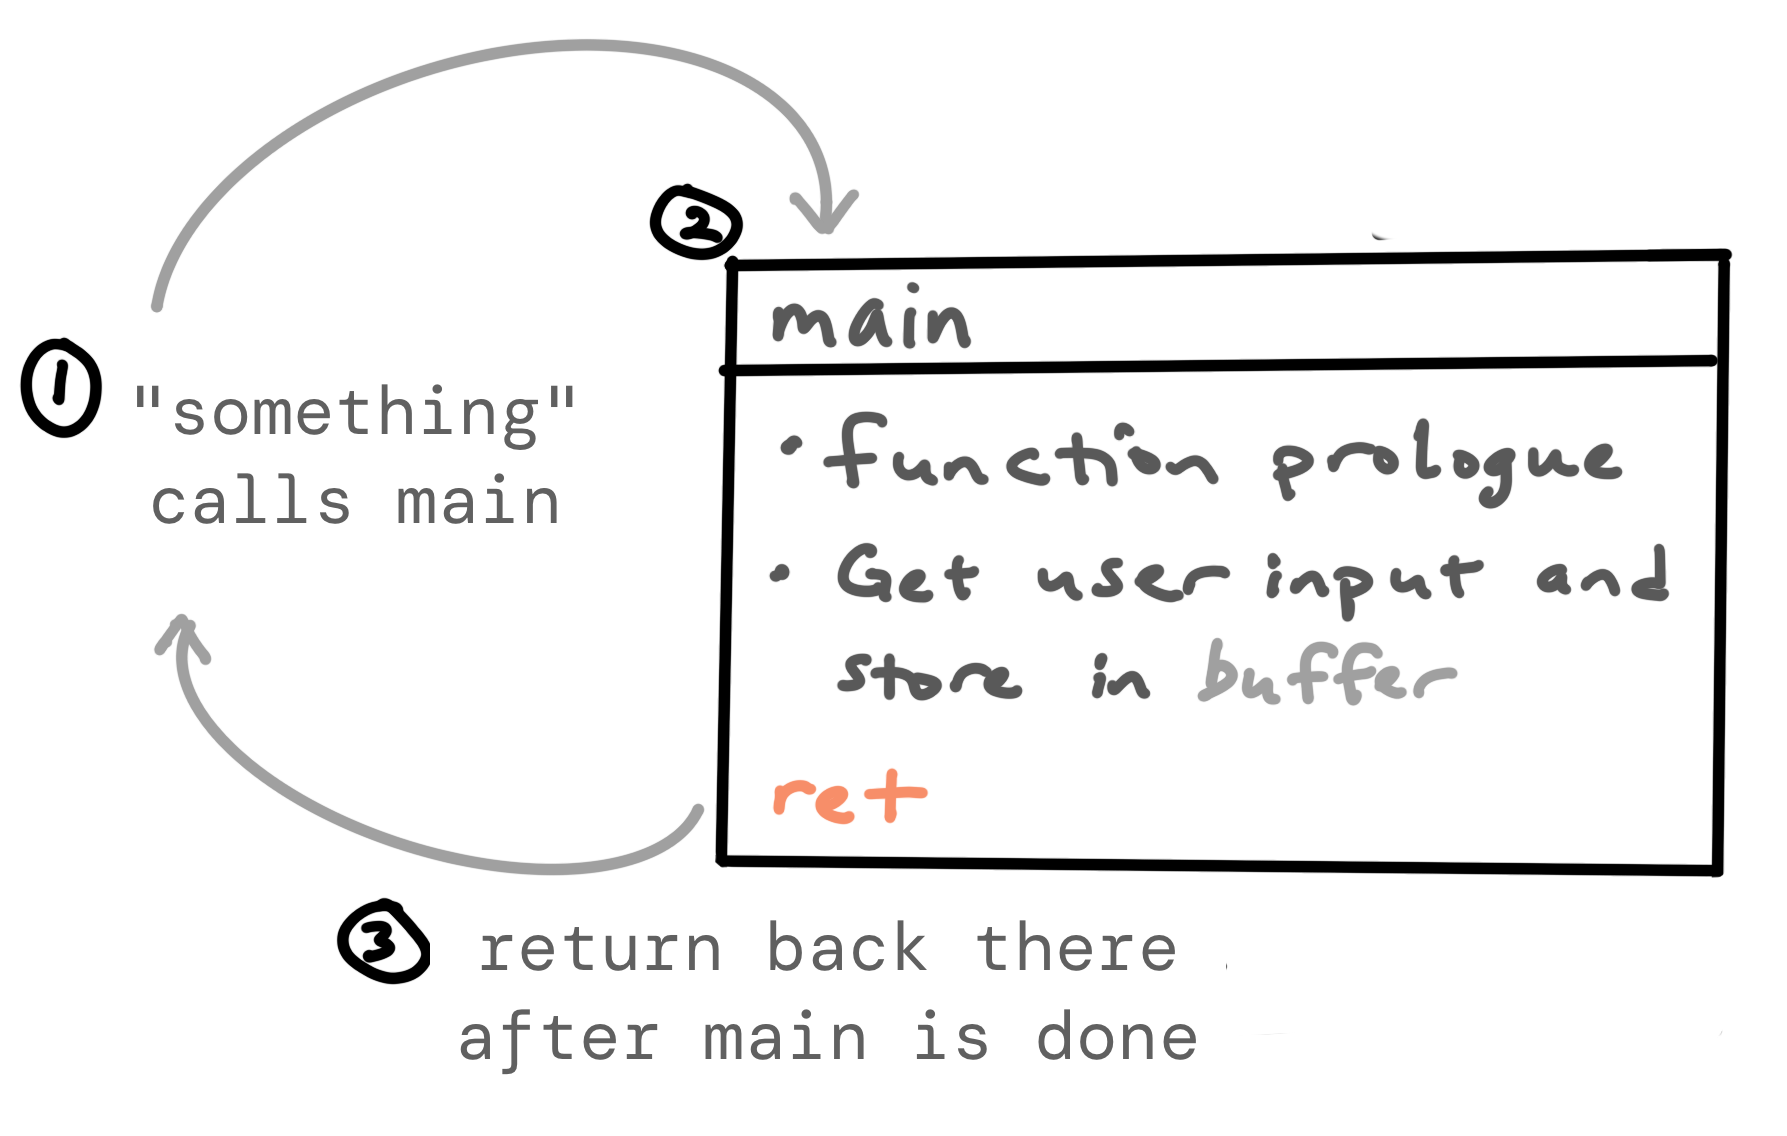
But how does the program know where to go, and how does our input have any control over this?
To discuss this further, let’s start with another metaphor:
Have you ever walked into a room and then forgot why you went in there? Or realized that you forgot to bring something with you?
Or maybe you remembered both of those things, but you were so overwhelmed by the madness going on in the room (thanks to your toddler/dog/cat/insert-other-creature-here) that it completely overwrote what you meant to do. You end up doing something different and get totally off-course.
What does this have to do with computer programs? It helps us understand how function calls work.
Stack frames
As the program executes each line, it has a data structure called the stack that helps it maintain context, move information around and get back to where it was called from. The buffer variable is stored on the stack, as is the return address.
Specifically, this data is being stored as part of a stack frame, which is a local grouping within the stack that here corresponds to everything the program needs to know in order to execute a given function (like main) and then return.

A stack frame contains the return address, a pointer to the previous frame pointer, local variables, and function parameters. Each time we have another function call, we’ll have another stack frame, storing the context we need for that function, and what to do once we get back to the function that called it. This is not unlike your brain trying to remember why you went into a given room, and then remembering where to go after you’ve achieved your mission there.
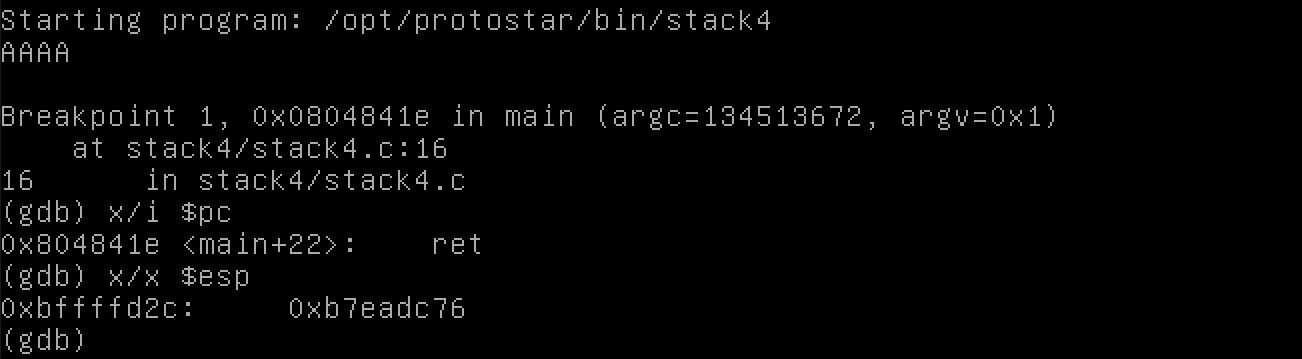
Back to our program: we will ret (return) from the end of main back to whatever part of code called this function. In other words, EIP will be pointing to the ret instruction.
At the same time, the stack pointer, which keeps track of relevant data on the stack (to be used in assembly instructions, etc), will be pointing to the return address of 0xb7eadc76.
Or at least, that’s what was supposed to happen.
We were able to fill up the buffer variable, and then keep writing until we overflowed past the previous frame pointer (EBP) and overwrote the return address as well.
We overwrote it with a bunch of As, resulting in an invalid return address of 0x41414141. Because that address does not exist, the program couldn’t finish executing, resulting in the segmentation fault we saw earlier.
Extending our “bof” Visual
I have a confession to make: the diagrams that I’ve shared thus far (where the buffer variable overflows into modified) weren’t complete. Part of the diagram was cut off, for the sake of simplification.
Now that we know about stack frames and the need for a return address, we can include that in our diagram:
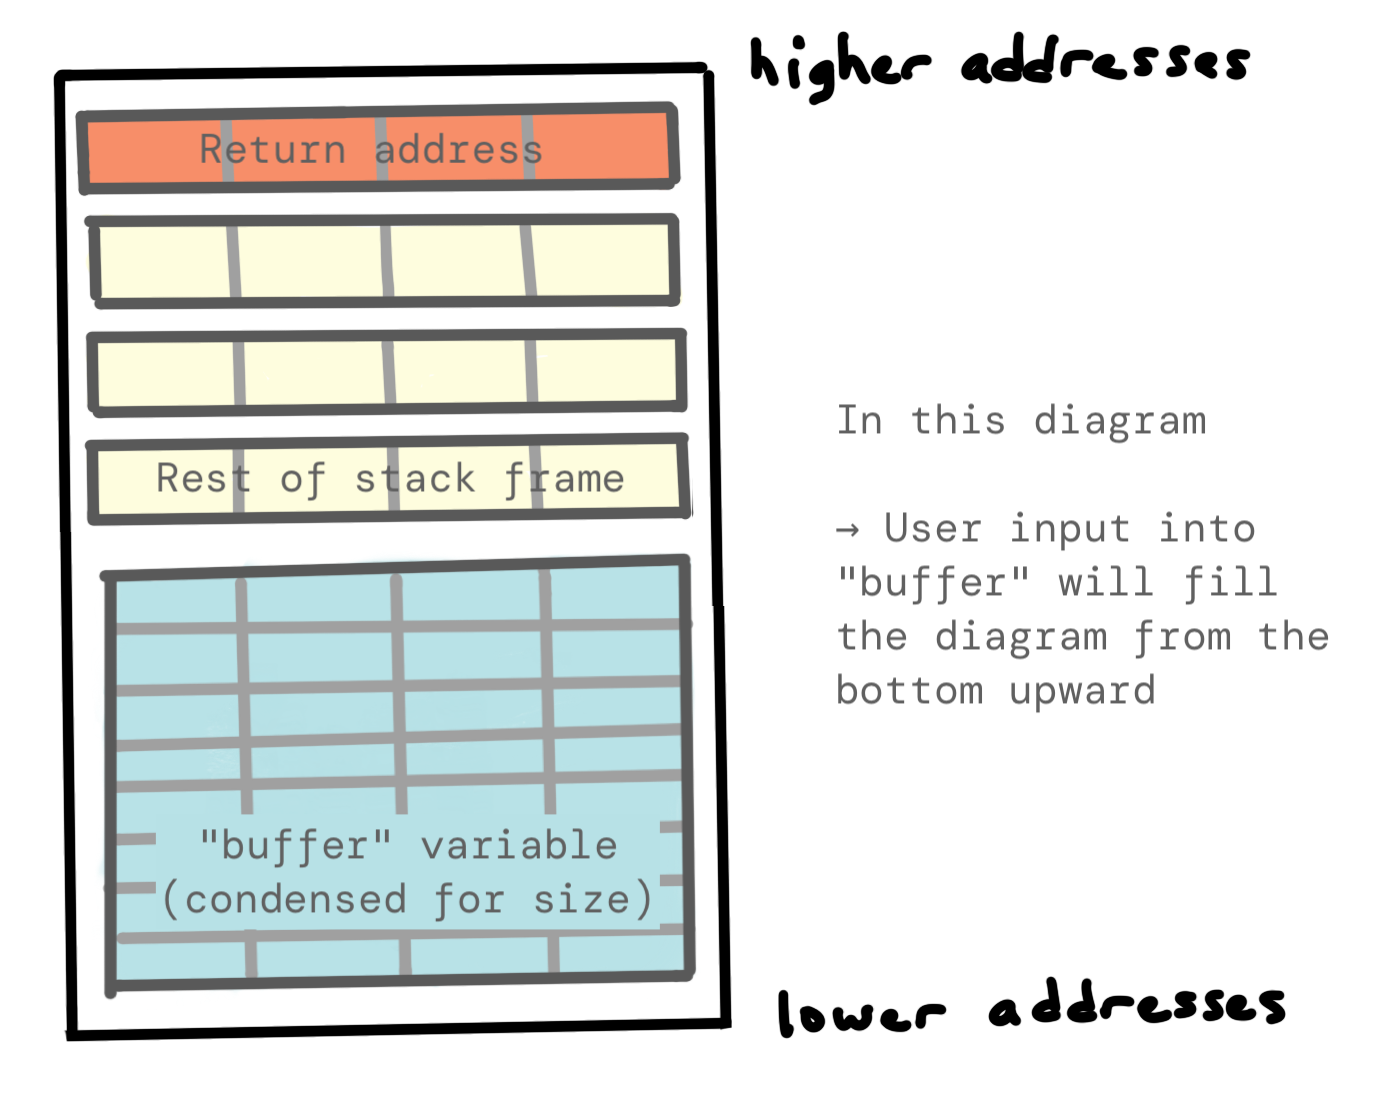
Or if you prefer the opposite view:

This extra space between buffer and the return address stores other variables like the previous frame pointer. We’ll need to overflow this too, which means we need to know the size of it. You could determine this in a variety of ways. You could use static analysis (looking at the assembly) or dynamic analysis, which means trying things out and using info registers in gdb (or similar) to see how your payload filled up each relevant register.
For the sake of this guide not being even longer, I’ll tell you that we need 12 bytes of additional filler, after we’ve filled up buffer.
In the earlier levels, we were controlling the code flow by controlling variables. By overflowing the buffer variable, we were able to overwrite other local variables. This is like walking into a room and the chaos (or memory issues ;)) overwriting your plans for what you were going to do in that room.
Here, we’re going to upgrade our abilities and control the instruction pointer, EIP, to go to a different location in code. This is like walking into a room where there’s so much toddler/pet chaos that it overwrites your brain’s plan to ret back to a different room. Instead, you end up running to the cleaning supplies, or the fridge. It’s not a perfect metaphor, but hopefully it helps.
Let’s wrap up our last level for this guide. We have the same buffer size as before (64 chars), then 12 bytes of additional filler to fill up the rest of the stack frame, and then our new return address.
Where do we want to go?
The win function, obviously. But where is that?
We can use gdb (or another software RE tool like Binary Ninja, Ghidra, etc) to find the address.
Open the file in gdb by typing gdb stack4. Then look at the win function by typing disas win or disassemble win.
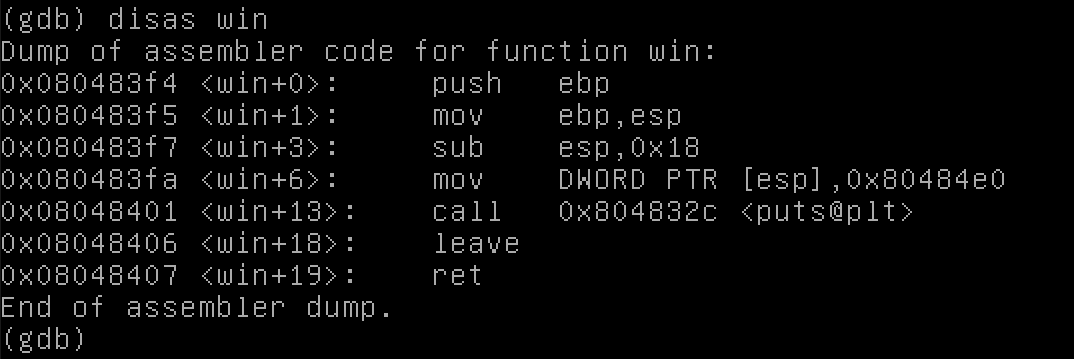
This shows us the assembly instructions for the win function, as well as the address in memory for each one.
The function starts at 0x080483f4. That’s where we want to go.
Putting it all together
Alright. 64 bytes of filler for buffer, an additional 12 bytes of filler for the stack frame, then the address of win.
'A'*64 + 'B'*12 + <win address>
Did you forget endianness? I hope not.
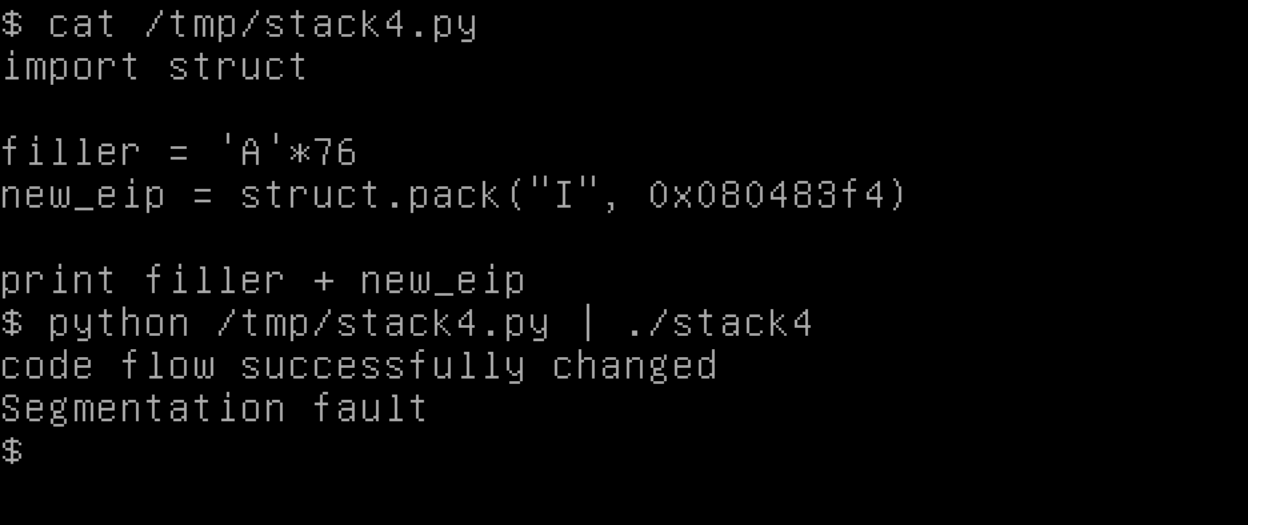
Our win address of 0x080483f4 needs to be swapped for endianness to 0xf4830408.
If you’re using a tool like Python to input the payload, you’ll need to encode the win address bytes, since now we’re working with non-ASCII readable characters. To do so, you add \x in front of each bye:
'A'*64 + 'B'*12 + '\xf4\x83\x04\x08'
To input that into the program, you can use the following line, which prints up the payload and pipes it into the stack4 program:
python -c "print('A'*64 + 'B'*12 + '\xf4\x83\x04\x08')" | ./stack4

Or you can use a framework like pwntools so you don’t have to do the endianness changes by hand:
Here’s what our exploit looks like, animated:
And as always, here’s a view with the opposite orientation:
What did we learn?
Let’s wrap this up with some more takeaways:
- All code that can be executed has an addressable location, and since we can overwrite EIP, we can control the code flow to go wherever we want in memory.
- Functions occupy a spot in memory designated by an address. And in our case, those addresses don’t change with each run (no ASLR).
- When we want to use one of these addressable locations, we need to keep endianness in mind.
- We learned a little bit more about the stack and stack frames. BaseCS is a great series to learn more.
- We saw how to encode non-ASCII characters in our Python command, and a bit of pwntools to script our payloads.
You can see how these ideas build on themselves. First we needed to learn about bits, then hex, then ASCII, then endianness, then stack frames.
As you can imagine, not all CTFs challenges (and certainly not ‘real world’ software) contain such obvious issues or (literal) win() functions. But we’re getting there, bit by bit.
To Be Continued…
If you made it all the way to the end, you are now able to do a basic “bof” (buffer overflow) CTF challenge, and understand what’s happening. Woo!
In my original talk, I also covered several more levels, involving things like: shellcoding, nop sleds, reverse shells, ret2libc, and other fun stuff like pwntools and libc memes.
However, this post is already very long. So if you enjoyed reading this and want me to expand the series, please share this guide and/or let me know your thoughts!